CORRELATIONS AND CAUSALITY
Types of Data & Measurement Scales:
Four Types of Variables
Nominal, Ordinal, Interval and Ratio
These four measurement scales: nominal, ordinal, interval, and ratio
Nominal Variables
- nominal comes from name
- The important thing is there is no measure of distance between the values. You're either married or not married. Nominal scales name and that is all that they do. pregnancy status (pregnant, not pregnant.
- Nominal scales are used for labeling variables, without any quantitative
“Nominal” scales could simply be called “labels.”
two categories (e.g. old /young) is called “dichotomous.”
If you are a student, you can use that to impress your teacher.
- A categorical variable, also called a nominal variable
Ordinal
- the order of the values is what’s important and significant, but the differences between each one is not really known.
- The best way to determine central tendency on a set of ordinal data is to use the mode or median
- the order matters but not the difference between values. For example, you might ask patients to express the amount of pain they are feeling on a scale of 1 to 10.
A score of 7 means more pain that a score of 5, and that is more than a score of 3.
But the difference between the 7 and the 5 may not be the same as that between 5 and 3. The values simply express an order.
- little more sophistication than you can get with just names alone
- Ordinal implies order. And, order means ranking. So the things being measured are in some order. You can have higher and lower amounts. Less than and greater than are meaningful terms with ordinal variables where they were not with nominal variables.
- ordinal scales both name and order. Interval Variables
Interval
Celsius and Fahrenheit temperature variables called interval variables
- They are called interval variables because the intervals between the numbers represent something real. This is not the case with ordinal variables.
- Interval variables have the property that differences in the numbers represent real differences in the variable.
- Another way to say this is that equal equal differences in the numbers on the scale represent equal differences in the underlying variables being measured.
- Interval scales are numeric scales in which we know both the order and the exact differences between the values. The classic example of an interval scale is Celsius temperature because the difference between each value is the same.
Ratio Variables
- Ratio variables have all the properties of interval variables plus a real absolute zero.
- That is, value of zero represents the total absence of the variable being length measures in the english or metric systems, time measures in seconds, minutes, hours, etc., blood pressure measured in millmeters of mercury, age, and common measures of mass, weight, and volume
- ratios are meaningful with this type of variable. With ratio variables, the only difference from interval variables is that you have a true zero so that you can actually talk about ratios
- they tell us the exact value between units, AND they also have an absolute zero–which allows for a wide range of both descriptive and inferential statisticsto be applied.
CORRELATION
The correlation is one of the most common and most useful statistics.
A correlation is a single number that describes the degree of relationship between two variables.
Correlation analysis is a method of statistical evaluation used to study the strength of a relationship between two, numerically measured, continuous variables (e.g. height and weight).
Correlation is used to test relationships between quantitative variables or categorical variables. In other words,
- it’s a measure of how things are related.
The correlation analysis is used when the researcher wants to determine the possible association between the variables and to begin with; the following steps are to be followed:
- Determining whether the relation exists and then measuring it (The measure of correlation is called as the Coefficient of Correlation).
- Testing its significance
- Establishing the cause-and-effect relation, if any.
In the correlation analysis, there are two types of variables- Dependent and Independent.
The purpose of such analysis is to find out if any change in the independent variable results in the change in the dependent variable or not.
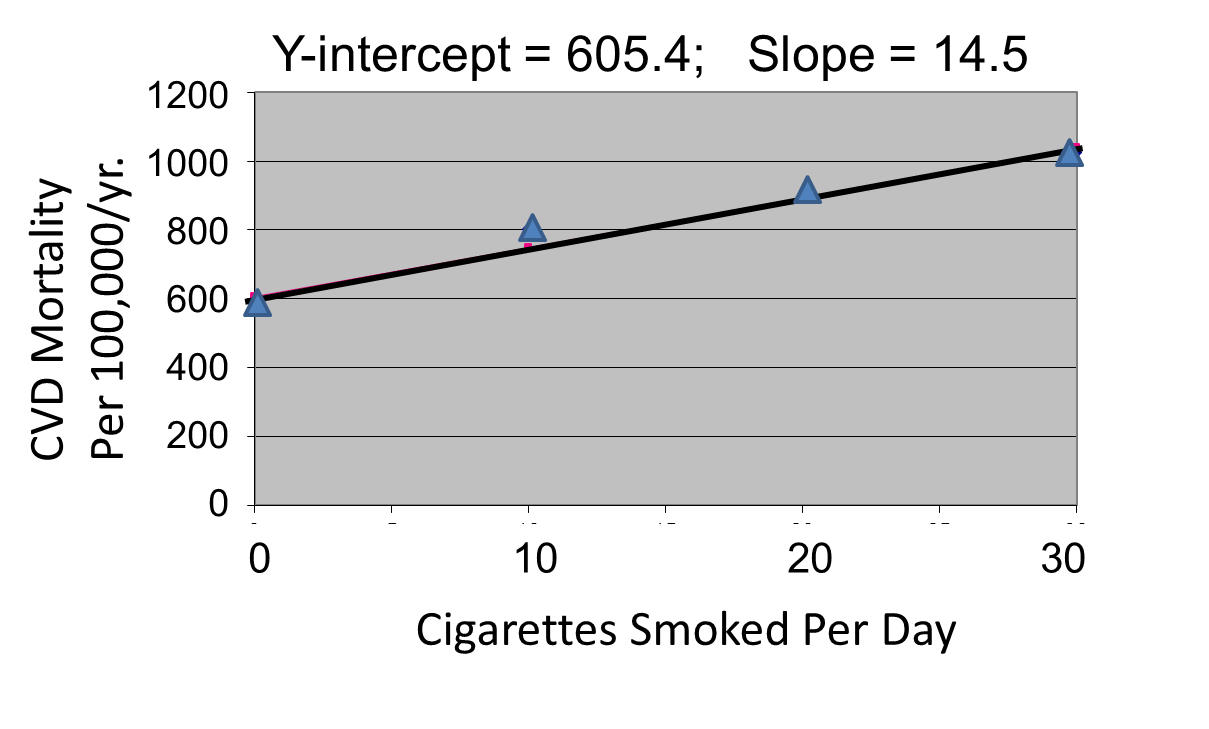
Once a relationship has been established using correlational analysis, a model can be created that allows the researcher to use an explanatory variable to predict an outcome variable, which is a statistical technique known as simple linear regression.
A causal relationship can be established using regression.
However, correlational analysis is only appropriate to explore relationship between variables and not to infer causal relationship.
r-value—
- The way that correlation is reported statistically
The degree to which two factors appear to be related. r-value
The way in which correlation is reported statistically (a number between -1 and +1).
Generally, the absolute value of the r-value should be greater than 0.3 in order to report a significant correlation (i.e. The r-values must be either < -0.3 or > +0.3).
- An r-value of -1 indicates a extreme negative correlation between two variables - as one variable's value tends to increase, the other variable's value tends to decrease.
- An r-value of +1 indicates an extreme positive correlation between two variables - as one variable's value tends to increase, the other variable's value also tends to increase.
An r-value of 0 means there is no correlation at all between the elements being studied.
It's a number between –1 and +1. If r=0, there is little or no correlation between two variables.
When the number is higher, the positive correlation between two variables is greater.
- Generally, r-values should be >.3 in order to report a significant positive correlation
Correlation—The degree to which two factors appear to be related.

https://www.statisticshowto.datasciencecentral.com/wp-content/uploads/2012/10/pearson-2-small.png
http://sphweb.bumc.bu.edu/otlt/mph-modules/bs/bs704_multivariable/bs704_multivariable5.html
http://sphweb.bumc.bu.edu/otlt/mph-modules/bs/bs704_multivariable/bs704_multivariable5.html
http://sphweb.bumc.bu.edu/otlt/mph-modules/bs/bs704_multivariable/bs704_multivariable5.html
http://sphweb.bumc.bu.edu/otlt/mph-modules/bs/bs704_multivariable/BS704_Multivariable6.html
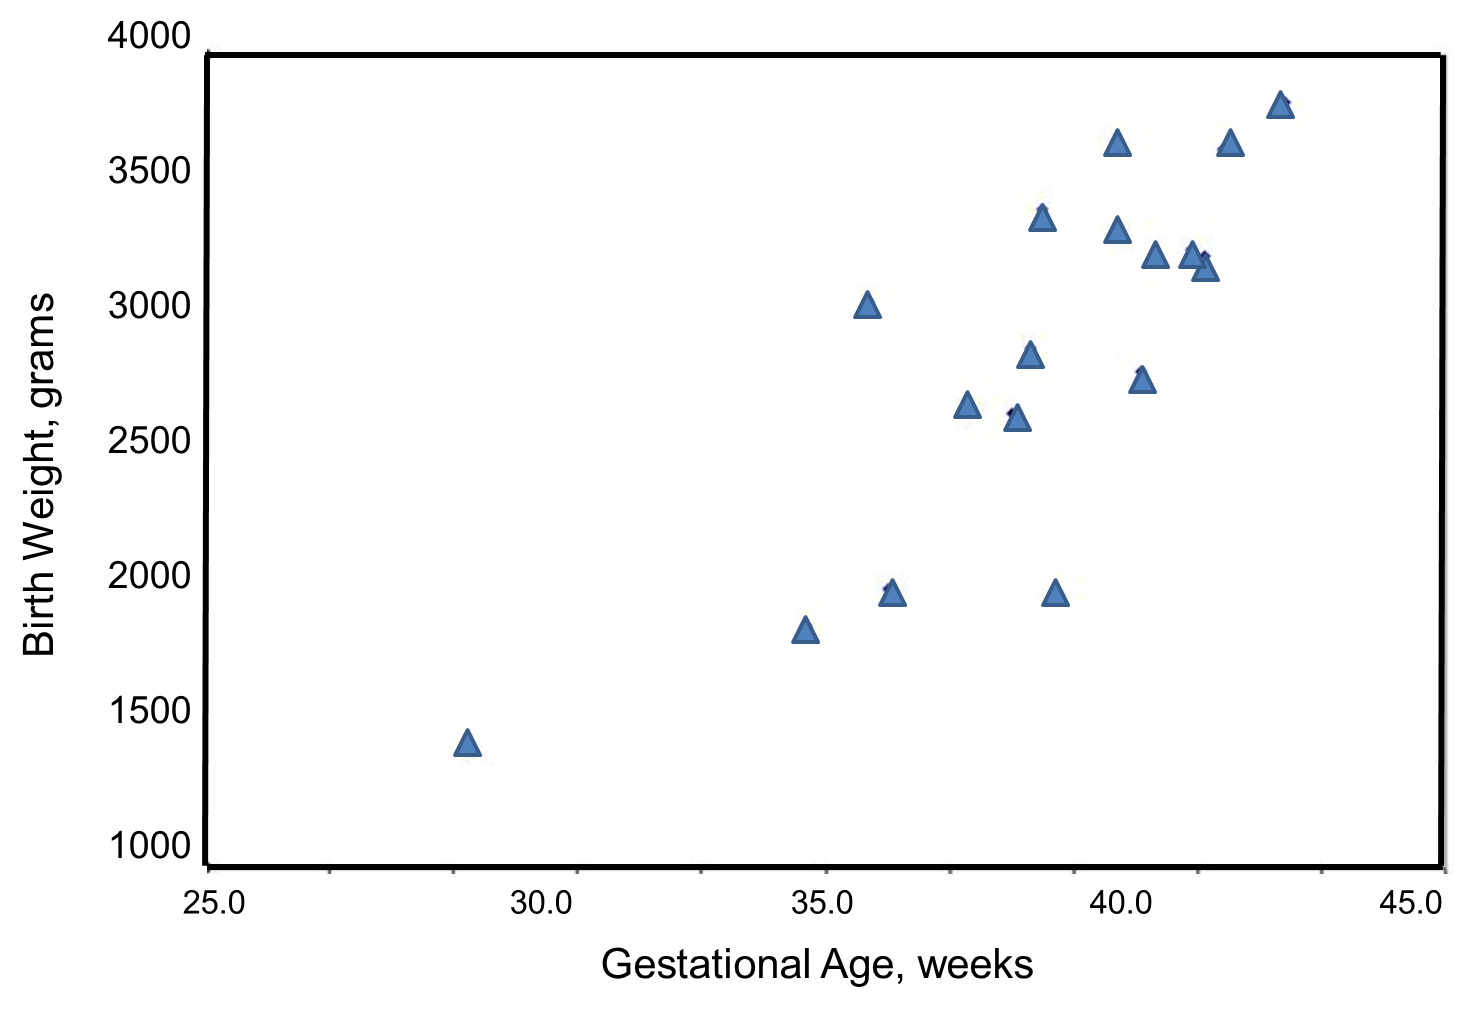
Note that the independent variable is on the horizontal axis (or X-axis),
and the dependent variable is on the vertical axis (or Y-axis).
There are also statistical tests to determine whether an observed correlation is statistically significant or not (i.e., statistically significantly different from zero).
What is Correlation Analysis?
https://www.youtube.com/watch?reload=9&v=eFVNyjq0TB8
Methods of correlation and regression can be used in order to analyze the extent and the nature of relationships between different variables.
In correlation analysis, we estimate a sample correlation coefficient, more specifically the Pearson Product Moment correlation coefficient. The sample correlation coefficient, denoted r,
ranges between -1 and +1 and quantifies the direction and strength of the linear association between the two variables.
Testing the Significance of a Correlation
Once you've computed a correlation, you can determine the probability that the observed correlation occurred by chance.
In this case, you are testing the mutually exclusive hypotheses:
| Null Hypothesis: | r = 0 |
| Alternative Hypothesis: | r <> 0 |
Correlation Matrix
The correlation coefficient is a measure of linear association between two variables. Values of the correlation coefficient are always between -1 and +1.
Regression analysis is a related technique to assess the relationship between an outcome variable and one or more risk factors or confounding variables.
Types
The most common correlation coefficient is the Pearson Correlation Coefficient.
Simple, Partial and Multiple Correlation
For the Pearson r correlation, both variables should be normally distributed (normally distributed variables have a bell-shaped curve).
Continuous data: Data that is interval or ratio level. This type of data possesses the properties of magnitude and equal intervals between adjacent units. Equal intervals between adjacent units means that there are equal amounts of the variable being measured between adjacent units on the scale. An example would be age. An increase in age from 21 to 22 would be the same as an increase in age from 60 to 61.
An alternative statistic that can be employed in measuring association between ordinal variables is Kendall's Tau-a, where each pair of observations is examined and classified as concordant or discordant. Kendall's Tau coefficient is computed based on the ordering of the values and extreme values do not alter the estimate of the coefficient.
The most common test statistic used to examine the association between ordinal variables is the Spearman's rank-order correlation (rs), also referred to as Spearman's rho [ρ].
Autocorrelation (serial correlation) implies the correlation among the values of the same variables but at various times. Autocorrelation coefficient is calculated by changing lagged data with the formula for the Pearson product-moment correlation coefficient.
Neither regression nor correlation analyses can be interpreted as establishing cause-and-effect relationships.
Association with nominal variables
Relationship between nominal variables can be assessed by cross-tabulating data in a contingency table and computing the Pearson's Chi-square statistic (χ2). The computed Chi-square value can be tested for statistical significance where the null hypothesis is no relationship exists between the variables. Most statistical packages produce χ2 along with the p-value. The existence of a relationship between nominal variables can be determined using the χ2 statistic.
Direction
The sign of the coefficient indicates the direction of the relationship.
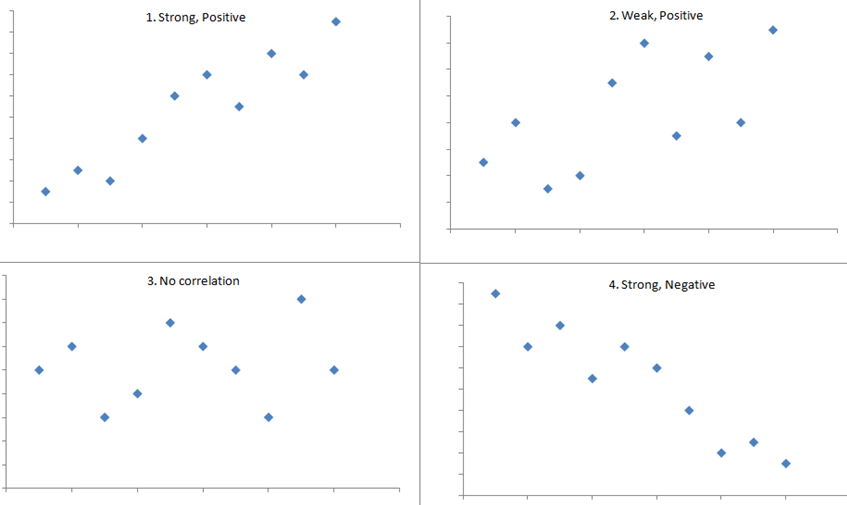
The following plots show data with specific correlation values to illustrate different patterns in the strength and direction of the relationships between variables.
No relationship: Pearson r = 0
How “close” do you have to get to –1 or +1 to indicate a strong linear relationship? Most statisticians like to see correlations above +0.60 (or below –0.60)
Fundamentals: Correlation and Causation
CORRELATION VS. CAUSATION
https://www.youtube.com/watch?v=VMUQSMFGBDo
- If the objective is to determine which variable might be causing a certain behavior (whether there is a cause and effect relationship between variables) causal research must be undertaken.
- We are always coming up with explanations for why things happen: why we got into a particular school and not into another, why people treat us the way they do, why we gain or lose weight, why we oversleep.
- When we take the idea of causation seriously, however, it becomes complex and even threatening.
- Notions of cause and effect that make easy sense in the materialistic realm of the natural sciences become more unsettling when applied to human beings.
- In order to determine causality, it is important to hold the variable that is assumed to cause the change in the other variable(s) constant and then measure the changes in the other variable(s).
- This type of research is very complex and the researcher can never be completely certain that there are not other factors influencing the causal relationship, especially when dealing with people’s attitudes and motivations.
- There are often much deeper psychological considerations, that even the respondent may not be aware of.
Establishing Cause and Effect
Cause = “Producing”
- The first step in establishing causality is demonstrating association; simply put, is there a relationship between the independent variable and the dependent variable
Changes in the value of the independent variable must be accompanied by changes in the value of the dependent variable
To establish whether two variables are causally related, that is, whether a change in the independent variable X results in a change in the dependent variable Y,
- Time order: The cause must have occurred before the effect
- Non-spuriousness: It must be established that the independent variable X, and only X, was the cause of changes in the dependent variable Y; rival explanations must be ruled out.
three criteria are generally considered as requirements for identifying a causal effect:
(1) empirical association,
(2) temporal priority of the independent variable, and
(3) non spuriousness.
You must establish these three to claim a causal relationship
- A necessary cause
- A sufficient cause
We can evaluate the association using the following criteria:
- The association is strong.
- The association is consistent.
- Higher doses are associated with stronger responses.
- Alleged cause precedes the effect.
- The alleged cause is plausible.

https://www.med.uottawa.ca/courses/epi6181/course_outline/Causes2.htm
- Statement ‘rain causes mud’ implies an asymmetric relationship: the rain will create mud, but the mud will not create rain.
- Use ‘→’ when refer such causal relationship;
- There is no arrow between ‘rain’ and ‘other causes of mud’ means that there is no direct causal relationship between them;
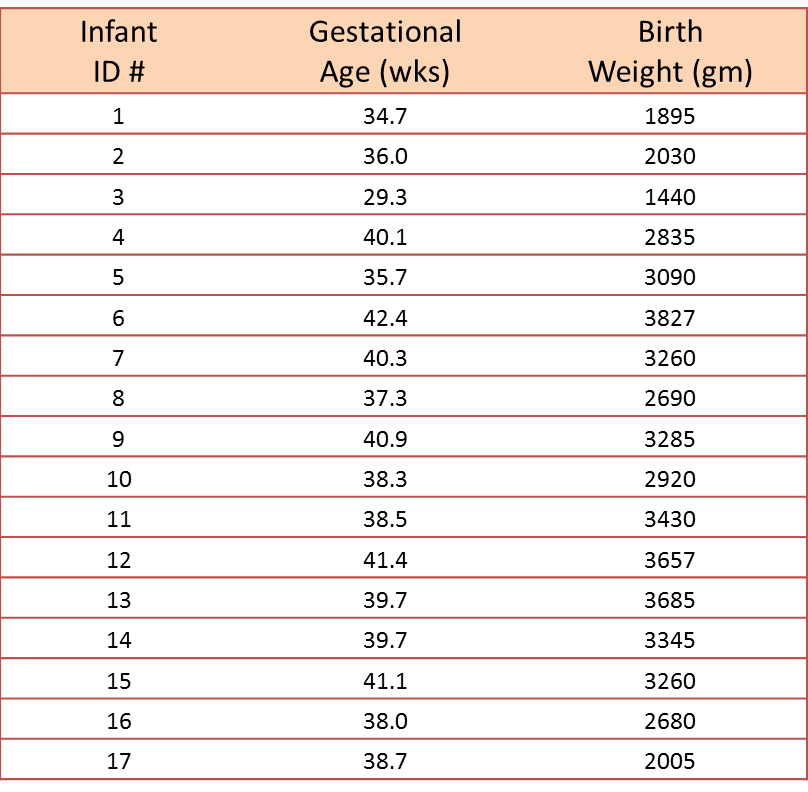
Bivariate Data are two quantitative variables
How Ice Cream Kills! Correlation vs. Causation
https://www.youtube.com/watch?v=VMUQSMFGBDo


Linear Causality
Measuring Causal Effects in the Social Sciences
https://ru.coursera.org/lecture/causal-effects/lecture-1-the-nature-of-causal-effects-and-how-to-measure-them-tEejq
https://www.cfa.harvard.edu/smg/Website/UCP/causal/causal_types.html
Measuring Causal Effects in the Social Sciences
Causation
Correlation should not be confused with causation. Just because two factors are reported as being correlated, you cannot say that one factor causes the other. For example, you might find a correlation between going to the library at least 40 times per semester and getting high scores on tests. However, you cannot say from these findings what about going to the library, or what about people who go to libraries often, is responsible for higher test scores.